Accessible via https://admin.sightcall.com/analytics/reporting.
SightCall provides a basic Analytics platform, providing quick and easy access to several reporting dashboards, allowing for reporting on the number of users, cases, calls, and average duration. Example statistics are shown below.
The date range and type of use case reported on (for example, traditional Agent to Guest vs Mobile Agent) can be selected to provide more granular information.
In the Analytics view, data is tenant-wide and not broken down into (for example) individual use case or user.
Note that Analytics data cannot be exported.
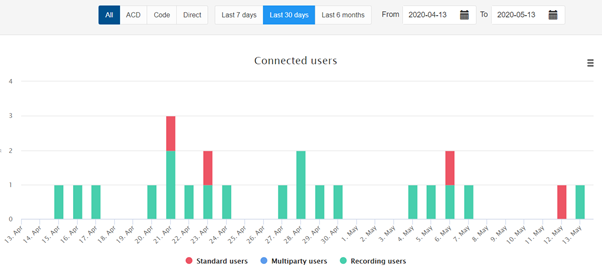
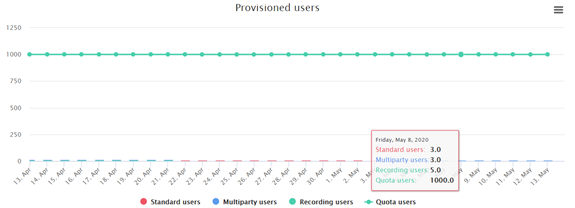
- Connected and Provisioned Users
In this view, SightCall provides an overview of User and License Management data. This includes the total available license count, the number of users currently provisioned, and the daily average number of connected agents.
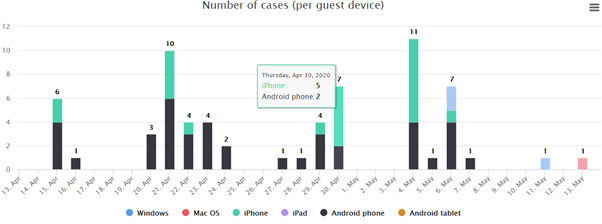
- Number of cases (per guest device)
In this view, SightCall provides a breakdown of the number of SightCall cases. A SightCall case refers in this graph to each individual SightCall between Agent and Guest users during the same session.
- Number of calls (per guest device)
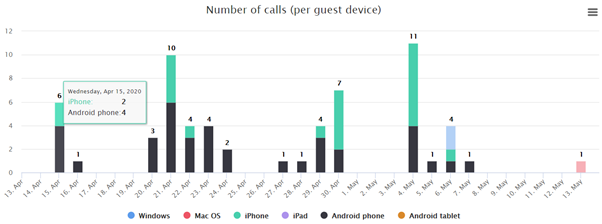
In this view, SightCall provides a breakdown of the number of SightCall calls. A SightCall call refers in this graph to each individual successful SightCall between Agent and Guest users.
- Average Duration
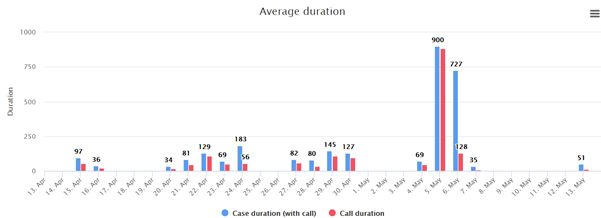
In this view, we see the average duration of calls and cases. The call duration refers to the time the SightCall agent and guest spend specifically within a call. The case duration refers to the total amount of time on each case including the time spent waiting for the SightCall guest to connect to the call.